


![[Experiments]](../../../inline/bannerExperiments.jpg)
![]()
![]()
![]()
![]()
User Visits [Talking Heads 2]
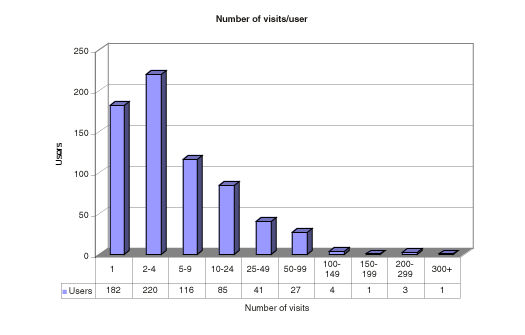
This graph shows the number of visits made by each user. The horizontal axis represents a visiting frequency, the vertical axis the number of users who visited with that frequency.
|
User Visits [Talking Heads 2]
This graph shows the number of visits made by each user. The horizontal axis represents a visiting frequency, the vertical axis the number of users who visited with that frequency. |