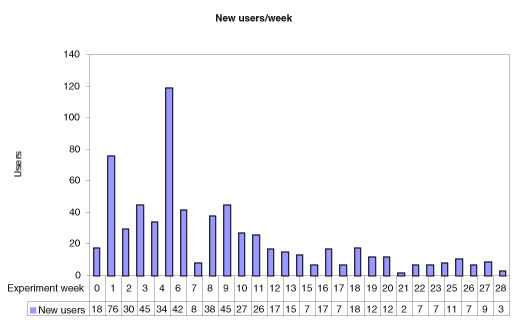
New Users per Week [Talking Heads 2]

This graph indicates the number of users creating and launching new agents during each week of the experiment. The actual number of visitors was higher, but only users who launched at least one agent are counted.


![[Experiments]](../../../inline/bannerExperiments.jpg)